
Moving beyond averages to find the hidden capacity in your roster.
This builds on the "You Can't Automate a Mess" case study: once the map is trustworthy, Force-to-Load turns it into an execution-ready capacity model.
One of the loneliest positions for a leader is standing in the gap between a Finance team asking, "Why is this costing so much?" and an Operations team voicing urgent distress: "We are drowning."
The Friction
Often, the organization lacks a shared language to reconcile these two realities. A company might rely on legacy spreadsheets that average out "headcount" against "ticket volume." But averages obscure the struggle.
A spreadsheet doesn't know that your technicians in one region are facing a two-hour commute between sites, or that a team is bogged down by "dirty data" from tickets left open over a weekend.
To move from operational strain to sustainable performance, we must move from broad assumptions to surgical precision. We need to build a Workforce Capacity Model — the Force-to-Load (F2L).
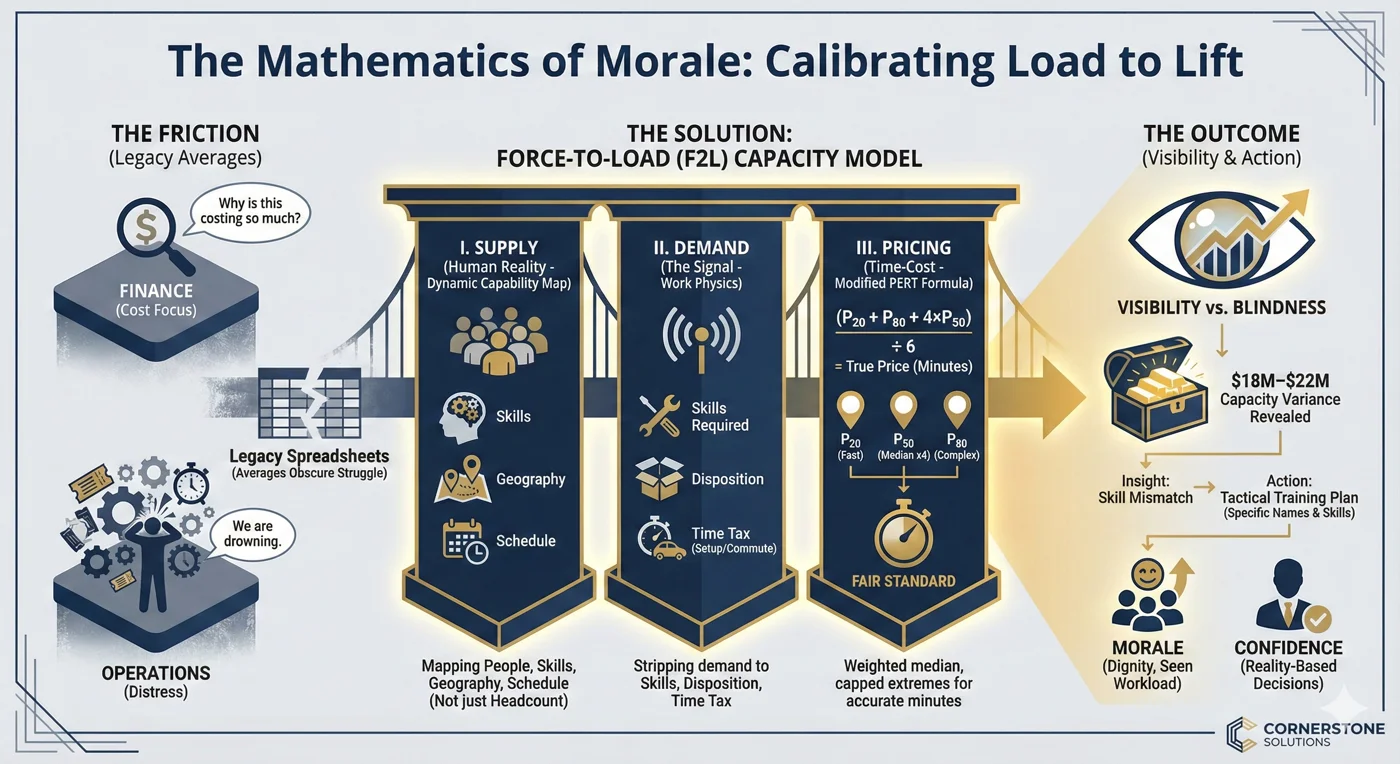
The F2L Model: Supply, Demand, and Pricing in minutes — a shared language for Finance and Operations.
When Jeffrey Benson partners with leaders to architect these systems, we focus on synthesizing three critical components: The Supply, The Demand, and The Pricing.
Pillar I
Supply — The Human Reality
Supply is often oversimplified as "FTEs." But a generic FTE cannot solve a specific problem. To measure Supply accurately, we honor the reality of the roster by replacing static lists with a Dynamic Capability Map:
- The People: The actual inventory of human resources.
- The Skills: What are they certified to handle? (Distinct from job title.)
- The Geography: Where are they dispatched vs. where do they live?
- The Schedule: The reality of shifts and availability.
By mapping this backward (what did we have?) and forward (what will we have?), we transform "Supply" from a static number into a live view of capability.
Pillar II
Demand — The Signal
Demand is the work to be done. To model this, we strip the demand signal down to its physics:
- Skills Required: Connecting the request to the specific capability needed.
- Disposition: Is the work Open, Closed, or Pending?
- The Time Tax: Setup times, commute times, and execution time.
Pillar III
Pricing — The Time-Cost
This is where the model moves from "reporting" to "intelligence." In this context, Pricing does not mean dollars; it means Minutes.
Standard models often fail here because they rely on simple means (averages), which get skewed by outliers — like a ticket accidentally left open for 400 hours, or one closed with 0 minutes.
To find the "True Price" of a task and protect the team from skew, we utilize a Modified PERT Formula (Program Evaluation Review Technique):
Modified PERT Formula
Price (min) = (P₂₀ + P₈₀ + 4 × P₅₀) ÷ 6
- P₂₀ (20th Percentile): The fast, easy runs.
- P₈₀ (80th Percentile): The complex, difficult runs.
- P₅₀ (Median): The standard, normal run.
Why this matters: By weighting the median (×4) and capping the extremes, we arrive at a fair, defensible standard. We don't expect teams to perform at the speed of the fastest outlier, nor do we pad the numbers with data errors.
IV. The Outcome: Visibility vs. Blindness
Once the model calculates in minutes, the translation to dollars is simple algebra. In a recent engagement, this surgical view surfaced significant opportunities:
- The Insight: The model revealed an $18M–$22M capacity variance.
- The Cause: This wasn't about "cutting heads" — it was about Skill Mismatch.
- The Reality: We were paying for capacity "on the clock" that didn't align with the incoming demand signal.
Without the F2L model, that opportunity was invisible — hidden inside the "averages."
From Insight to Action
But identifying the value is only half the job.
We didn't just hand leadership a $22M valuation and wish them luck. We operationalized the data. We showed them exactly which technicians in which geographies needed to cross-train in what specific skills to close those gaps.
We moved from a high-level "Eureka" moment to a granular execution plan — converting a theoretical financial opportunity into a tactical roster of names and training requirements. This is the standard for Actionable Business Intelligence.
Beyond Efficiency: The Dignity Dimension
This is about more than just efficiency; it's about dignity.
When a model is accurate, teams feel seen because their actual workload is reflected in the data. When the data is accurate, executives feel confident because they can make decisions based on reality, not guesswork.
If your current capacity planning feels like a blunt instrument, it might be time to sharpen the tools. Let's look at the data together and see what the math is trying to tell us.
The Cornerstone Takeaway
Averages hide friction — and they hide opportunity.
When capacity planning is built on blunt "headcount vs. volume" averages, Finance and Operations end up debating two different realities. Force-to-Load replaces guesswork with a shared language: supply, demand, and pricing in minutes — so decisions are grounded in what the work actually costs the team to perform.
From insight to action: Cornerstone doesn't stop at identifying the variance — we operationalize it. The deliverable is an execution-ready plan that shows which skills are missing where, and translates that into a tactical training plan (often down to specific geographies and, when appropriate, a roster-level plan by name/skill) so leaders can close gaps instead of just discussing them.
How we engage
Typical starting point: 2–4 weeks diagnostic/onboarding → 6–12+ weeks foundation cleanup (scope-dependent) → 8–12 weeks model build, validation, and operationalization.
Service pillars
This work is delivered through our five service pillars: Management Consulting, Change Management, Business Analytics, Data Reporting, and Custom Software Development.
Where this rigor applies
Cornerstone is built for scale moments — when strategy is clear, but execution is constrained by operational friction, misaligned process, or untrusted data.
- Field operations: dispatch/routing, scheduling, overtime, touchless automation.
- Capacity decisions: demand vs. supply, headcount justification, cross-training strategy.
- Automation that's amplifying chaos: AI/RPA built on dirty data or weak governance.
- "Single source of truth" gaps: spreadsheet cycles, conflicting metrics, low dashboard trust.
- OpEx transformations that must stick: standard work, SOPs, control plans, KPI cadence.
If you're leading cost, capacity, or service performance — and your models feel blunt — let's talk. We'll pressure-test the math, surface the real constraints, and map a path from insight to action.
If the morale side of this story hit close to home, the first case study, "You Can't Automate a Mess", walks through where this all started: fixing the underlying data and geometry so your people — and your metrics — can finally tell the truth.
Let's build something better, together.