
How correcting the "Hidden Geometry" of our service map restored field trust and unlocked $22M in capacity.
This case study comes from large-scale field operations, but the same pattern shows up anywhere automation is being asked to compensate for dirty data, weak governance, or broken process design.
The "Smarter Algorithm" Trap
In the race to optimize Field Operations, companies often fall into a specific trap: when the automation fails, they try to make the algorithm "smarter." They add more logic layers, more complex rules, and more code.
In a previous executive role, our Principal Jeffrey Benson witnessed this dynamic firsthand.
A Global Network Operations unit was struggling with their automated dispatch tool ("The Autoloader"). For months, the business and IT teams had been trying to improve the tool's performance by adding complex rule sets. Yet, the needle barely moved. In fact, as the rules got more complicated, the Autoloader's success rate often declined.
The Field didn't trust the tool, IT was frustrated, and Leadership expected results.
Cornerstone's philosophy is that operational strain is usually a data or process problem in disguise. Jeffrey Benson examined the foundation.
Act I
The Governance Vacuum
The root cause wasn't the algorithm. It was "Zip Code Anarchy."
Because no single team held governance over the map, the definition of a "Work Area" had suffered from years of unchecked drift. Any manager could create a work area or assign a zip code.
- The "Six-Assignment" Error: Single Zip Codes assigned to six different legacy Work Areas.
- The "Ghost" Geography: Because of accidental data entry, some zip codes were assigned to work areas in entirely different states.
The Autoloader wasn't broken; it was being fed hallucinations. It was authorized to send a technician hours away because the bad data said the job was "in their territory." IT initially pushed back on the proposal to clean this up, believing the algorithm could handle the noise. As Operators, we knew better.
The Fix: Geometry & Diplomacy
We realized we could not build a sophisticated Capacity Model (Force-to-Load) until we fixed the map. This required two things: Forensic Redesign and Field Partnership.
Step 1
The "Strawman" Design
Our team took the lead. We partnered with the Capacity Management team and led the draft designs for entire states using best practices — accounting for contiguous zip codes, river crossings, bridges, and traffic patterns. We ensured every zip code lived in exactly one home.
Step 2
The Field Sessions
We didn't dictate the map; we co-authored it. We held working sessions with Supervisors and Technicians, walking them through our drafts.
- The "Why": We explained that contiguous areas meant less drive time and fewer "illogical" Autoloader assignments.
- The "How": We tweaked the boundaries based on their local knowledge — "That mountain pass is closed in winter; don't group those zips."
This wasn't just data entry; it was Change Management. By the time the map was finalized, the Field had already stamped it with their approval.
Step 3
The Governance Lock
Once the cleanup was complete, we established a new protocol: only the Capacity Management team had the authority to alter Work Areas. The era of "Zip Code Anarchy" was over.
The Micro-Win: A 10% Lift
The impact of "cleaning the hygiene" was immediate. By simply feeding the Autoloader a rationalized map — no overlaps, logical boundaries — we achieved a 10% Year-Over-Year lift in Autoloader success.
After months of failed attempts to code a solution, we proved that better data is necessary for smarter algorithms.
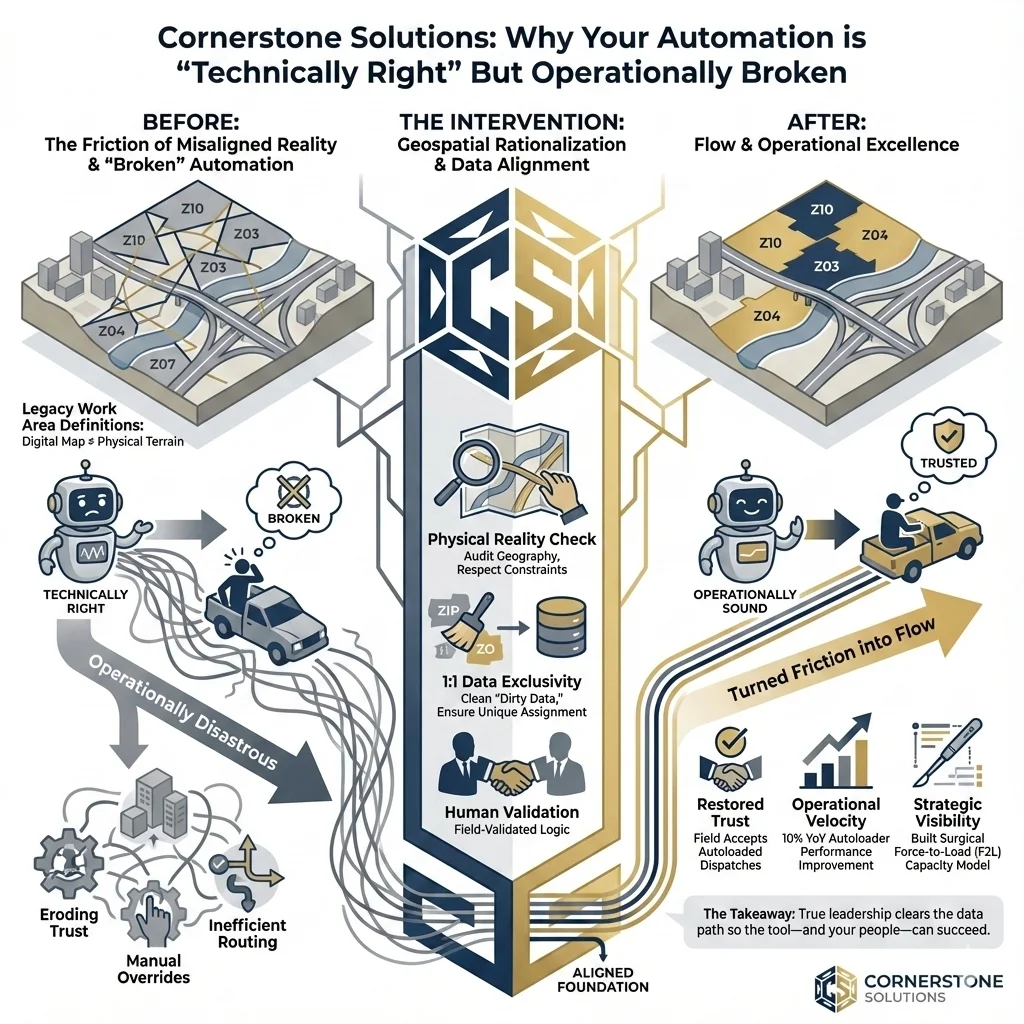
The "Technically Right" Trap: why perfect code fails when the underlying data is flawed.
Act II
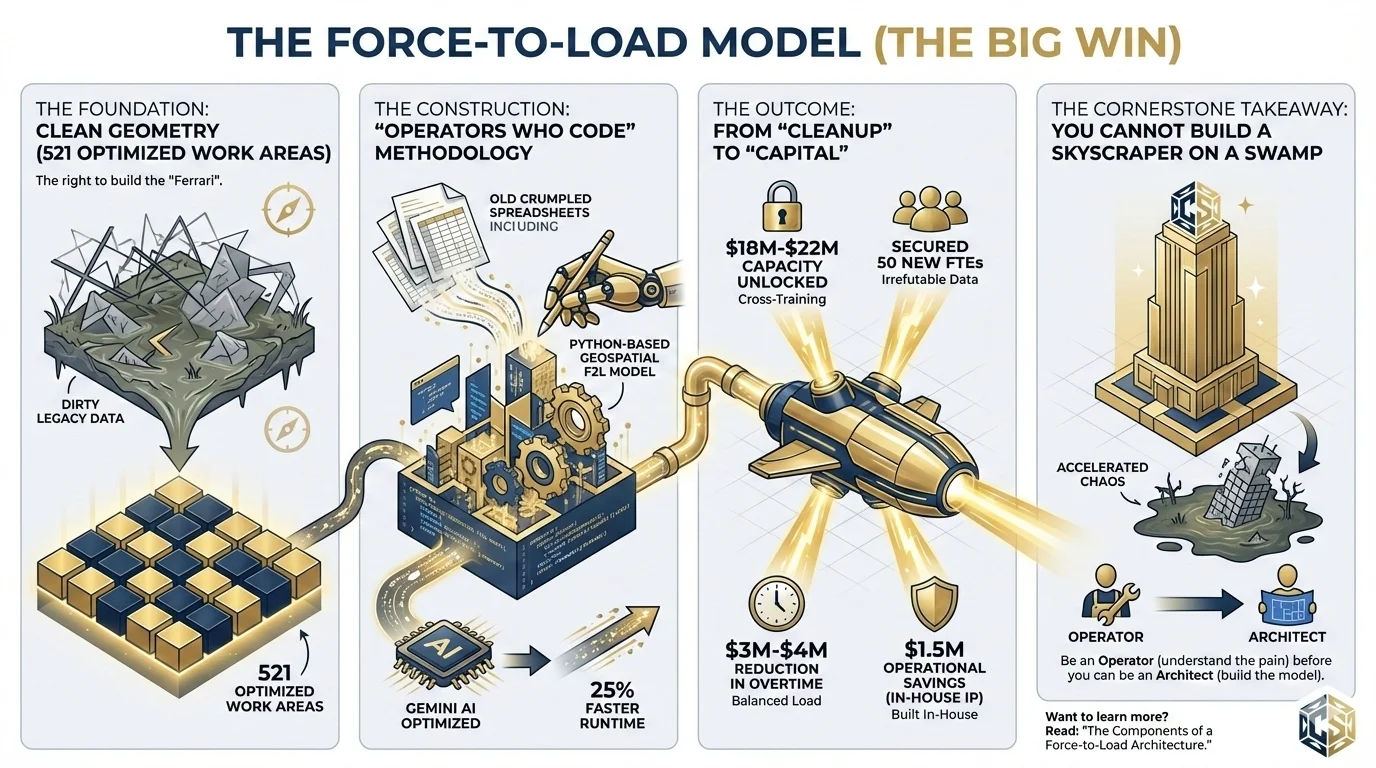
The Force-to-Load Model (The Big Win)
With a clean, rationalized foundation — 521 optimized Work Areas — we earned the right to build the "Ferrari."
This is where the Cornerstone "Operators who Code" methodology took over. We transitioned from the cleanup phase to the construction of a custom Force-to-Load (F2L) Capacity Model.
- The Architecture: We replaced static spreadsheet models with Python-based scripts that treated the new work areas as geospatial entities.
- The Speed: Using Gemini AI to optimize our code, we reduced model runtime by 25%, allowing for rapid "What-If" scenario planning.
The Outcome: From "Cleanup" to "Capital"
The project began as a way to fix a broken dispatch tool, but because we built a clean data foundation, it ended as a strategic financial victory.
- $18M–$22M in Capacity Unlocked: By overlaying supply and demand data onto our new, clean Work Areas, we identified that "shortages" were often just skill mismatches. We deployed targeted cross-training that unlocked millions in productivity.
- Secured 50 New FTEs: We gave leadership the irrefutable data they needed to justify headcount where the demand actually existed.
- $3M–$4M Reduction in Overtime: By balancing the load across mathematically balanced areas, and giving them demand by shift for scheduling adjustments, we reduced the burnout spend.
- $1.5M Operational Savings: We built this capability in-house, retaining the IP.
The ROI of clean geometry: how fixing the map unlocked $22M in capacity.
The Cornerstone Takeaway
You cannot build a skyscraper on a swamp.
Many organizations try to implement advanced AI or capacity models on top of dirty legacy data. The result is rarely efficiency — it's usually accelerated chaos. At Cornerstone Solutions, we believe you must be an Operator (who understands the pain of the field) before you can be an Architect (who builds the model to fix it).
Want to go deeper on Force-to-Load? Read the companion piece on the core components of a Force-to-Load architecture.
How we engage
Typical starting point: 2–4 weeks diagnostic/onboarding → 6–12+ weeks foundation cleanup (scope-dependent) → 8–12 weeks model build and operationalization.
Service pillars
This work is delivered through our five service pillars: Management Consulting, Change Management, Business Analytics, Data Reporting, and Custom Software Development.
Where this rigor applies
Cornerstone is built for scale moments — when strategy is clear, but execution is constrained by operational friction, misaligned process, or untrusted data.
- Field operations: dispatch/routing, scheduling, overtime, touchless automation.
- Capacity decisions: demand vs. supply, headcount justification, cross-training strategy.
- Automation that's amplifying chaos: AI/RPA built on dirty data or weak governance.
- "Single source of truth" gaps: spreadsheet cycles, conflicting metrics, low dashboard trust.
- OpEx transformations that must stick: standard work, SOPs, control plans, KPI cadence.
Behind every metric in this case study is a person carrying weight they shouldn't have to carry. If this story felt familiar, the companion article, "The Mathematics of Morale: Calibrating Load to Lift", walks through how we used the same model to protect morale, dignity, and trust in the work.
Let's build something better, together.