A Partnership Approach to Eliminating the Friction Costing Your Organization Millions, By Restoring Visibility and Building the Data Systems Your Teams Can Actually Run
Chapter 1
The Leader Carrying the Weight
You own a piece of the business. Maybe a large piece. P&L accountability, an organization to lead, a budget in the multi-million to billion-dollar range. The buck stops with you, and you feel it.
And somewhere in your operation, there is friction that has been there long enough to feel normal. Things that should flow don't. Work gets stuck between teams. Systems don't talk to each other. Three people do the same task three different ways. Data lives in disconnected spreadsheets, and nobody can tell you with confidence what is actually happening on the ground right now.
You know it's costing you. But the full picture has been hard to see.
- Capacity you're paying for but can't use — because skills don't match where the demand is landing.
- Contracts bleeding millions — because usage was never tracked against minimum fee thresholds.
- Overtime ballooning to $3M–$4M — because the scheduling system can't see where people are or what they can actually do.
- Leaders stuck firefighting — managing daily friction instead of executing the strategy they were hired to drive.
- Talented teams burning out — not from a lack of effort, but from a lack of clear process. When a high-performing team is struggling, it's rarely a people problem. It's operational strain they've been asked to carry.
Generic solutions fail in situations like this. Most consultants can either diagnose the problem or build the fix, rarely both. And when they can't bridge that gap, you get a beautiful process map that sits in a drawer, or a dashboard nobody trusts because it doesn't reflect operational reality.
What operational leaders in this situation need is a partner who can do three things at once: listen with empathy to understand the real pain on the ground, diagnose the root cause with the rigor of a Lean Six Sigma Black Belt, and build the data system that actually solves it, without waiting six months for IT to deliver something already outdated.
That is the work we do together.
Chapter 2
What Consistently Fails, and What Changes Everything
Three decades of working inside complex organizations revealed some consistent patterns. Not just about where processes break, but about why well-intentioned solutions fail to stick.
The first pattern: Solutions built without the people who have to live in them don't survive.
Early in my career, I watched technically correct solutions fail because they were designed in a silo. The data was solid. The process map was rigorous. But the operators who were supposed to use the system hadn't shaped it, so they didn't trust it, and it quietly died. That experience locked in the first principle: change management isn't an add-on to the work. It is structural. If the people who feel the friction every day don't see themselves in the solution, the solution will not survive contact with the organization.
This is why every engagement starts with listening. Not a survey. Not a data pull. Conversations with the people carrying the weight, before we build anything.
The second pattern: When visibility is low, the instinct is to add complexity. That almost always makes it worse.
In one engagement, a global operations unit had spent months adding logic to an auto-dispatch algorithm that wasn't performing. Each fix added rules. Performance barely moved. The data was reviewed together with the team, and the root cause surfaced: work area definitions were fragmented. A single zip code appeared in six different areas. The algorithm wasn't broken, the foundation it ran on was inconsistent.
Rather than debating the diagnosis, the team ran a pilot. Working with field supervisors in one region, the work areas were redesigned, contiguous, rational, grounded in local knowledge of traffic patterns and geography. When the auto-dispatch rate improved measurably, the data made the case. The pilot earned the green light, and the redesign rolled out nationwide.
The lesson is not "fix the data first." It's this: when you see something others don't yet see, stop arguing and build the pilot. Let the results do the talking.
The third pattern: Progress that works today beats perfection that arrives too late.
The tools in this work — Python, SQL, AI-assisted development — exist to solve the problem in front of us, not to produce elegant code for its own sake. An "inefficient" script that runs overnight and gives a team visibility they didn't have before is infinitely more valuable than a technically pristine system still in planning six months from now. The discipline is knowing what's good enough to move the organization forward, and what needs to be more robust before it goes into production.
This is the orientation that drives the work: operational leaders deserve solutions they can use now, built to scale as their needs evolve.
Chapter 3
The Collaborative Process
Here is how we move from "we have this friction problem" to "the system is running and the team owns it."
Step 1 · Weeks 1–4
Listen, Map, and Align
This is where most engagements rush. We don't.
The first weeks are dedicated to building shared understanding. That means conversations with everyone who touches the process, not just leadership looking at KPIs, but the operators and supervisors feeling the friction daily. Where does it hurt? What are you carrying that you shouldn't have to carry? What workarounds has the team built because the official system doesn't work?
At the same time, functional process decomposition is underway, a method combining SIPOC and IDEF0 analysis that maps what is actually happening step by step, not what the three-year-old PowerPoint says is happening. This goes into a detailed working document that becomes a shared artifact the team can react to and correct.
We also identify what is being measured (if anything), what data exists, and where it lives. Read-only access is secured so we can understand what the data actually looks like and what it means.
By the end of this phase: the friction is mapped, the people involved trust that they were heard, and we have the data access to diagnose the root cause.
Step 2 · Weeks 5–16+
Restore the Foundation
You cannot model complexity on a broken foundation. If the underlying data structure is fragmented, building analytics on top of it amplifies the problem. This phase addresses what is broken before anything new is built.
In the zip code engagement described in Chapter 2, this phase took three months, 40,000+ data points rationalized into 521 clean work areas. That work was done in close partnership with field supervisors, because they carry local knowledge that no data model can replace. They knew which mountain passes were impassable in winter. Which bridge closures broke contiguous routing. Which boundaries looked clean on paper but created chaos in the field. Their input turned a technically correct map into one the teams actually trusted, because they helped build it.
Governance was locked in at the end of that phase so the foundation stayed clean.
This step is scope-dependent. It could take six weeks. It could take twelve or more. But it is non-negotiable. Every solution built on a fragile foundation eventually inherits that fragility.
Step 3 · Weeks 17–28
Build, Show, Listen, Adapt
This is where the actual infrastructure takes shape — data pipelines, workforce planning models, dashboards, automated reporting. Whatever the specific problem demands.
The build is iterative. A first version is built and brought back to the team. And something useful happens at this point: because they can now see the data clearly for the first time, the team starts asking questions they couldn't have articulated before the build started. "Can we filter this by shift?" "Is there a way to flag when capacity drops below a threshold?" "What does this look like by geography?"
Some of those questions are a new query. Some require new dimensions in the pipeline. Either way, the model adapts. This feedback loop continues until the system is answering the questions that actually matter to how the operation is run, not just the questions we thought we had at the start.
The goal at the end of this phase is not a one-time analysis. It is infrastructure that keeps running.
Step 4 · Customized
Stewardship and Handoff
The goal is your team's independence, not ongoing dependency. The handoff is structured around your organization's capacity and culture:
- Retainer Support: Ongoing part-time stewardship for clients without internal technical capacity, or where the model is mission-critical and continuity matters.
- Internal Transition: Full documentation, architecture, data flow diagrams, maintenance playbook, plus structured training so your IT or data team owns and runs the system.
- Hybrid: Internal transition plus a 3–6 month support window where complex questions or updates are handled during the learning curve.
The right path is identified during the build phase, not at the end. The measure of a successful engagement is that the solution continues to deliver value long after the engagement closes.
Chapter 4
Selected Outcomes
These results were achieved through close collaboration with leadership and their operational teams.
You Can't Automate a Mess — But You Can Fix the Foundation
A Global Network Operations unit had been struggling with their auto-dispatch tool for months. The algorithm itself wasn't the problem. But field teams had stopped trusting it, and leadership was frustrated by the lack of progress despite repeated fixes.
Over 40,000 zip codes had been assigned chaotically across work areas, some appearing in six different areas, some in the wrong state entirely. The algorithm was being fed hallucinated geography. Every rule added to "fix" performance was compensating for broken data.
Working alongside field supervisors, the geographic foundation was rebuilt from the ground up. Local knowledge drove the redesign — teams knew the mountain passes, the bridge closures, the routing realities that no spreadsheet could capture. We rationalized 40,000+ zip codes into 521 clean, contiguous work areas. Governance was locked so the map stayed stable. Then, on that clean foundation, we built a Python/SQL Force-to-Load workforce capacity model that mapped supply (people, skills, geography, schedule) against demand, with PERT-based time pricing for each job type.
- $18M–$22M in hidden workforce capacity unlocked through a prioritized cross-training plan
- 50 new FTEs secured with irrefutable data-backed business case
- Annual overtime reduced by $3M–$4M
- Auto-dispatch success rate improved 10–20% from foundation cleanup alone
- $1.5M saved by building the capacity model in-house instead of engaging an external vendor
Clean foundations aren't glamorous. But the Ferrari doesn't run on broken pavement.
When Clarity Becomes the Culture Fix
A 24x7 Technical Support and Operations environment had a talent problem that wasn't a talent problem. The team was skilled and motivated. But they were being asked to guess their way through mission-critical tasks because nobody had documented how the work was supposed to be done.
The result was 50% annual attrition — not from bad culture or low pay, but from the quiet exhaustion of uncertainty. Talented people carrying weight they shouldn't have to carry.
No documented standards. No shared operating procedures. Each technician navigating complex, high-stakes tasks differently, without confidence that their approach was right. Procedural errors and critical outages were high, not from negligence, but from ambiguity built into the system.
Working alongside the team, we built an ISO 9000 Quality Management System from the ground up. 143 standard operating procedures, developed by walking the technicians through their actual daily work — process flows, if-then-else logic, decision trees for edge cases. Every document reflected what they actually did, refined through their input. A custom knowledge management system made everything accessible in the operating environment. External registration and re-registration audits passed.
- Procedural errors reduced 86%
- Critical outages fell 80%
- Attrition dropped from 50% to 1%
- All availability targets met for the first time in organizational history
True operational leadership is giving your team the dignity of knowing exactly how to win. When the friction of ambiguity is removed, the talent that was already there finally has room to perform.
The $40M Rationalization
An enterprise-wide mandate for significant expense reduction arrived with the usual reflex: freeze hiring, squeeze budgets, look for headcount to cut. But in a large, complex IT environment, the real waste wasn't in the headcount. It was in the geometry of the process itself.
An end-to-end IT asset lifecycle choking on its own complexity. Forensic decomposition revealed 400 distinct activities across procurement, deployment, and retirement. 200 identified waste drivers. A critical path where 43% of the steps were unnecessary — work that existed because it had always existed, not because it added value.
Rather than redesigning in isolation, we co-facilitated a 40-person Work Out session spanning from the data center floor to the SVP level. Every stakeholder who touched the process was in the room. The goal was not to present a new model — it was to build one together, with the people who would have to live in it. The old model was deconstructed, the vital few steps identified, and a new governance structure was institutionalized across the program.
- $40M in strategic savings through decommissioning 5,000 legacy servers
- 400% program ROI
- Asset acquisition velocity improved 82% — from 17+ weeks down to under 3 weeks
- Decommissioning cycle time reduced 36%
When a process has been running long enough, the waste becomes invisible. The value of forensic decomposition is making it visible again — so the team can decide what to keep and what to let go.
Breaking Through the 15-Servers-Per-Week Wall
A Fortune 20 enterprise security migration was stuck. 30,000+ UNIX/Linux servers needed conversion, and the team was processing 15 per week. At that pace, every executive deadline was unreachable.
The problem wasn't the people. They were working hard. The problem was the system they were working inside.
Manual workflows with no visibility into server readiness created a cycle of discovery failures during change windows. Teams were doing rework that should never have happened. Pre-qualification issues that could have been caught days earlier were surfacing at implementation time. And because data lived in 27 disconnected sources, nobody had a current view of where things actually stood.
A DMAIC transformation rebuilt the foundation for flow. An automated management information system was engineered, pulling 27 disparate data sources into a single unified view of server status and readiness. The workflow was re-engineered into a pull-based Pre-Qualify → Schedule → Implement sequence so that problems were found and resolved before the change window, not during it. Self-organizing Scrum teams were enabled with near-real-time data. Daily scrums shifted from status reporting to actual decision-making.
- Sustained velocity increased 2,126% — from 15 to 319 servers per week on average
- Peak weeks reached 500+ servers per week (33x the original rate)
- 27 integrated datasets turned status reporting into operational orchestration
- Program recognized at SVP level for delivery pace
Complex problems rarely need heroes. They need better processes and data architecture that lets the team already doing the work do it without unnecessary friction.
Governing $3B Without Drowning in Spreadsheets
During a merger integration, leadership needed precise, near-real-time control over $3B+ in data processing cash flows across a six-year program. The existing workflow was a manual reconciliation process — disconnected spreadsheets, no automated way to generate forward-looking "Best View" forecasts that merged actuals with estimates.
Without a better system, the team would have needed $4.2M in additional headcount just to keep pace with monthly reporting cycles.
A highly manual financial governance process that made accurate, timely reporting nearly impossible at scale. Every month was a scramble. Every forecast required hours of manual reconciliation that left the team with little time to analyze what the numbers actually meant.
An automated expense governance system was built to serve as the program's financial backbone — automated actuals reconciliation, dynamic "Best View" forecast logic that merged actuals with rolling estimates, and transformation layers that fed executive reporting directly from the pipeline.
- Leadership delivered ~$500M in run-rate OPEX synergy savings on hardware, software, and maintenance contracts
- $4.2M in labor costs avoided through automation
- Team freed from spreadsheet manipulation to focus on contract strategy and financial governance
- $3B+ in cash flows governed with precision across six years
A bigger team isn't always the answer. Sometimes the right investment is better data infrastructure — and the savings pay for themselves.
The Phantom Cost Hiding in the Fine Print
During a high-growth product launch, operational costs climbed faster than output. Leadership's first instinct was a productivity problem, maybe a people problem. A freeze was considered. But before cutting, the data was examined more carefully.
Escalating costs with no clear line of sight into the root cause. The team was working. Output was growing. But spend kept climbing, and nobody could explain exactly why.
Working alongside the finance and operations teams, usage data was analyzed against contractual terms — actual volume delivered versus the minimum fee thresholds embedded in vendor contracts. The gap was significant, and it wasn't a performance problem.
- Root cause identified: misaligned capacity contracts, not team productivity
- $1M–$2M in immediate annual savings roadmap delivered through contract renegotiation
- $4M–$6M in scalable savings potential identified across similar contract structures
- Leadership reframed "over budget" as "misaligned capacity" — protecting the team from an unnecessary hiring freeze
The most expensive line item on a P&L is sometimes the one nobody is using. Visibility into usage data can turn a budget problem into a contract negotiation.
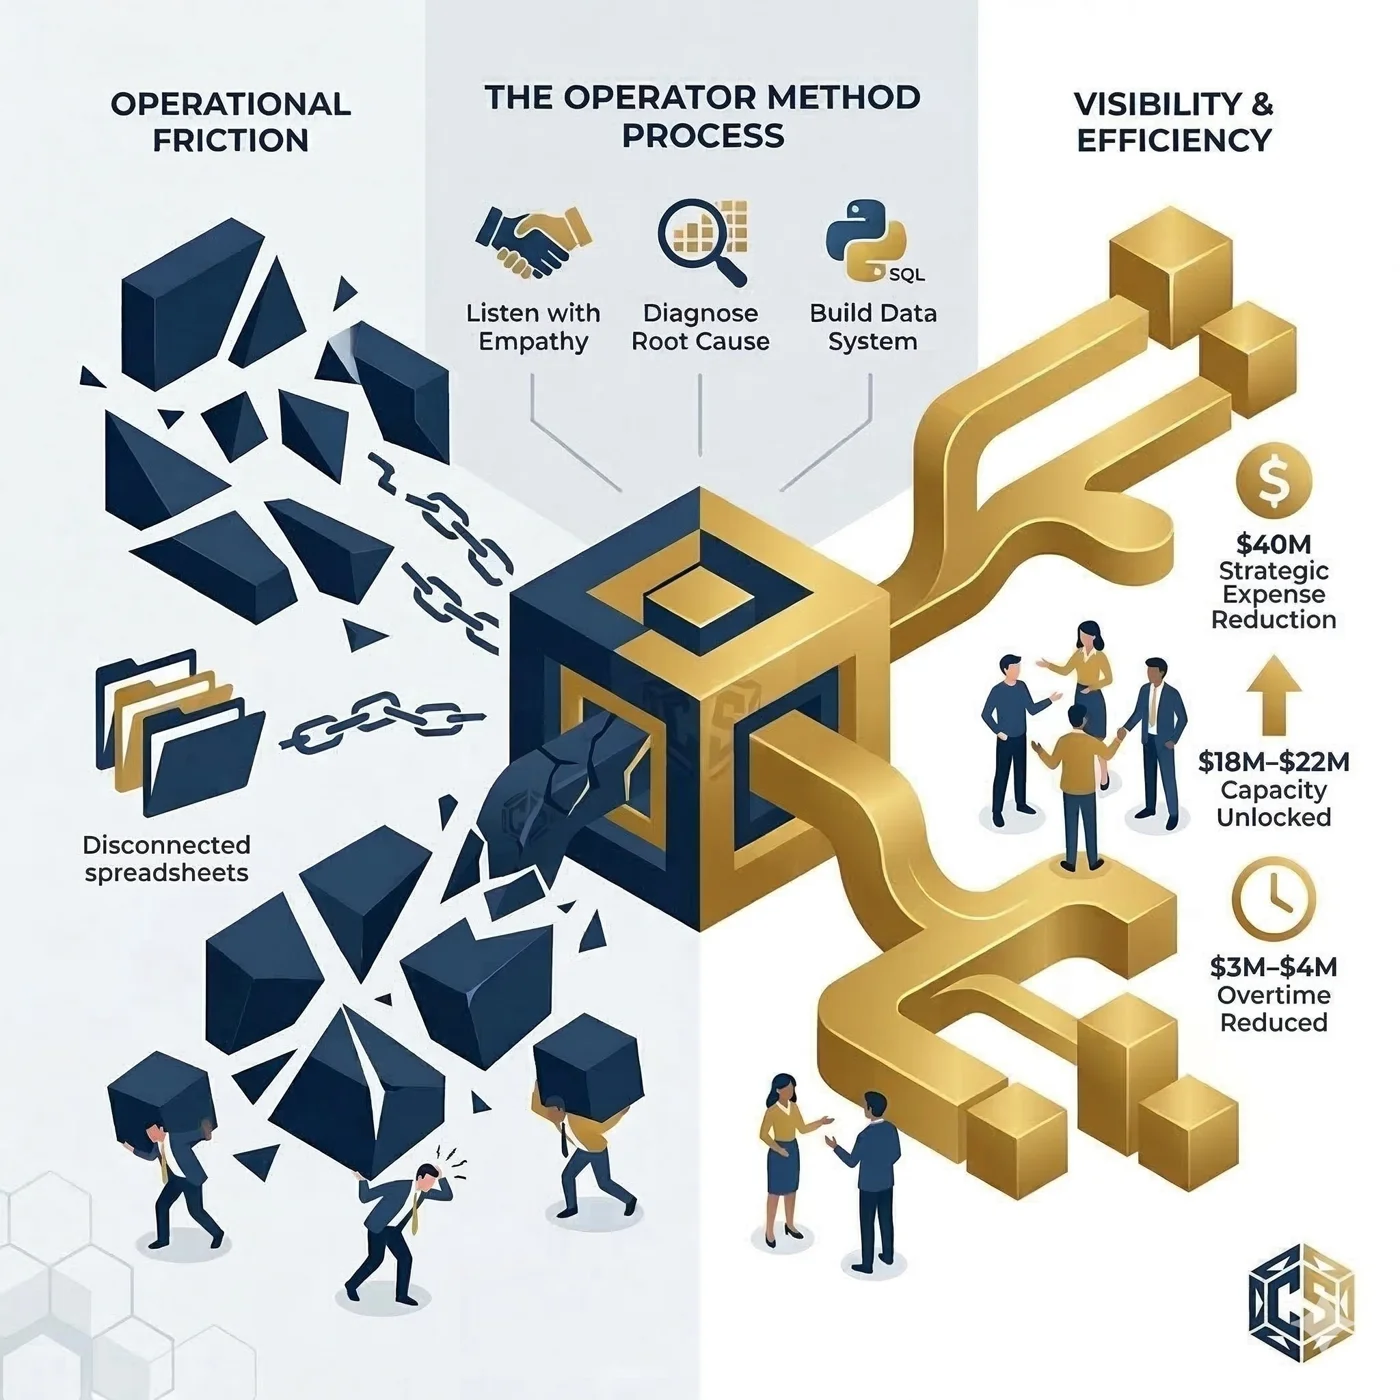
The Operator Method: from operational friction to visibility and efficiency.
From Method to Product
Distilling the Method Into Software
For most of my career this method lived in my head and in the rooms I was in — the structured interview, the functional decomposition, the four-lens model, all run by hand. That's also what kept it from scaling: it depended on me. Lately I've been building it into a product, working name Project Forester, so the rigor no longer requires me in the room. Each layer of the product maps to a capability already proven in the outcomes above — now made repeatable.
Chapter 5
Is This the Right Partnership?
This work is for operational leaders who own a piece of the business and know the friction is costing them time, money, and morale.
We are likely a good fit if:
- You are ready to look at uncomfortable data. Real improvement starts with visibility into what is actually happening, even when the picture is complex.
- You will involve your team. The people who feel the friction every day need to help shape the solution. A top-down fix without their input rarely survives contact with operations.
- You are open to fixing the foundation first. The most durable results come from solving the root cause, not accelerating a broken process. An $18M capacity unlock required months of foundation work before the model could be built.
- You value impact over optics. The goal is an operation that actually runs better, not a dashboard that looks good in the next board presentation but doesn't change anything.
- You are organizationally ready: real ownership of the problem, access to the relevant data, infrastructure to build on, and the willingness to act on what the data surfaces.
This may not be the right fit if:
- You need a cosmetic improvement to show progress by next quarter. This work takes time to do right. Quick wins exist, but sustainable transformation requires patience with the foundation phase.
- A top-down fix without team involvement is the only option available. Lasting systems require the people who live in them to help build them.
- You want a tool to install and walk away from. This work is collaborative and iterative — the systems that last are built with the people who run them.
The best engagements happen when leaders come ready to look at the whole picture, even when it is complex, even when some of what it reveals is uncomfortable. If that describes how you operate, we will work well together.
If you read the outcomes in Chapter 4 and saw reflections of the challenges your team is currently navigating, let's have a conversation.
About Jeffrey Benson
Jeffrey Benson founded Cornerstone Solutions on a straightforward belief: operational leaders deserve a partner who can both diagnose what is broken and build what fixes it, without waiting six months for IT, without six-figure consulting decks, and without making the leader look like they missed something obvious.
With 20+ years at Verizon spanning business transformation, workforce and capacity planning, operational excellence, and financial governance across Fortune 20 operations, Jeff brings the discipline of a Lean Six Sigma Black Belt with the practical fluency of someone who codes. The combination — what he calls "an Operator who codes" — means the bridge between real business needs and data engineering (Python, SQL, GenAI) gets built by someone who understands both sides of it.
The three foundations that guide every engagement:
- Diagnose with Empathy — find the true root cause, not the most visible symptom
- Automate to Elevate — free teams from manual work so they can do what only people can do
- Model for Reality — surface the hidden capacity, cost, and friction that's been too complex to see
Let's build something better, together.
Reach me through LinkedIn.